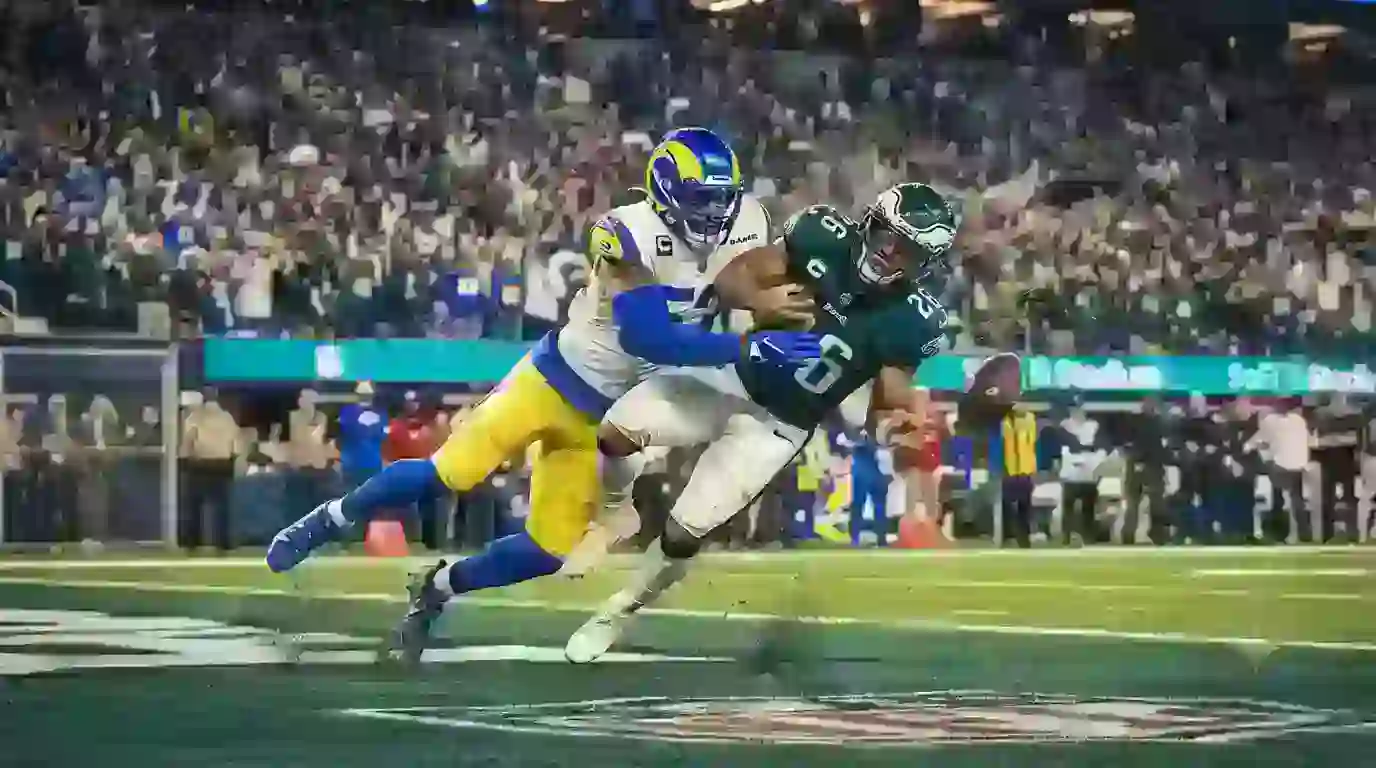
Los Angeles Rams vs Philadelphia Eagles Match Player Stats: Complete Player Performance Breakdown
Fans often scramble to find reliable numbers after a marquee NFL matchup. Scattered box scores and missing advanced details make it tough to know who really controlled the game. This breakdown solves that problem. You get every essential Los Angeles Rams vs Philadelphia Eagles match player stat, explained clearly—quarterback duels, rushing explosions, defensive stops, and the numbers that decided the outcome. No guesswork, no filler. Just the data that matters.
Game Overview and Final Score
Philadelphia walked into SoFi Stadium and left with a commanding 37–20 victory on Sunday Night Football. The Eagles leaned on a runaway ground attack that produced 314 rushing yards, while the Rams moved the ball through the air but failed to finish drives. The final score does not tell the whole story. These Los Angeles Rams vs Philadelphia Eagles match player stats reveal how the game tilted heavily toward the visitors after halftime. Philadelphia scored 24 unanswered points across the second and third quarters. Los Angeles managed only six points after the break. Total yardage favored the Eagles 481 to 328. Yards per play sat at 7.9 for Philadelphia and 5.3 for the Rams. The home team ran 62 offensive plays, the visitors 61. Efficiency, not volume, built the gap. The Eagles did not commit a turnover. The Rams turned the ball over zero times as well, yet still lost by 17 points. That statistical oddity only underscores how thoroughly Philadelphia controlled the line of scrimmage and the explosive play category.
Quarterback Comparison: Jalen Hurts vs Matthew Stafford
Jalen Hurts completed 15 of 22 passes for 179 yards and one touchdown. He added 39 rushing yards on 12 carries and scored once with his legs, keeping drives alive on third down with designed runs and scrambles. Matthew Stafford answered with 243 passing yards, two touchdowns, and zero interceptions on 24-of-36 passing. Hurts posted a 100.4 passer rating; Stafford finished at 112.3. The raw Los Angeles Rams vs Philadelphia Eagles match player stats favor Stafford’s volume and efficiency through the air. However, Hurts’ dual-threat impact created constant stress on the Rams defense. He converted two third-and-short situations with quarterback sneaks and scrambled for a critical first down that led to an Eagles field goal. Stafford took five sacks and faced pressure on 38 percent of his dropbacks, which limited his ability to push the ball downfield. His average depth of target sat at 7.4 yards, compared to Hurts’ 8.1. Despite the clean interception column, Stafford’s offense sputtered in the red zone, settling for short field goals twice.
- Hurts: 179 passing yards, 1 TD, 0 INT, 39 rushing yards, 1 rushing TD, 12 carries
- Stafford: 243 passing yards, 2 TDs, 0 INT, 5 sacks taken
Running Back Showdown: Saquon Barkley’s Historic Night
Saquon Barkley delivered a career-defining performance that will sit in Philadelphia record books for decades. He rushed 26 times for 255 yards and two touchdowns, averaging a staggering 9.8 yards per carry. His touchdown runs covered 70 and 72 yards, both coming on inside zone calls where he hit the hole at full speed and simply outran the secondary. Barkley also added four receptions for 47 yards, giving him 302 total yards from scrimmage. Kyren Williams countered with 72 rushing yards and one touchdown on 16 carries, adding a receiving score on a well-designed screen pass. The Los Angeles Rams vs Philadelphia Eagles match player stats underscore a massive gap in explosive plays. Barkley single-handedly outgained the entire Rams rushing attack by over 100 yards. He forced six missed tackles, per NFL Next Gen Stats, and gained 178 of his yards before contact, a credit to Philadelphia’s offensive line. Williams forced three missed tackles and averaged 4.5 yards per carry, a respectable figure that still paled next to Barkley’s eruption.
- Barkley: 255 rush yards, 2 TDs, 9.8 YPC, 4 catches, 47 receiving yards, 302 total yards
- Williams: 72 rush yards, 1 rushing TD, 1 receiving TD, 16 carries, 4.5 YPC
Wide Receiver Production: Brown, Smith, Nacua, Kupp
A.J. Brown hauled in six receptions for 109 yards and a touchdown, repeatedly winning one-on-one matchups against both man and zone coverage. DeVonta Smith added four catches for 50 yards and moved the chains twice on third down. For Los Angeles, Puka Nacua led all receivers with nine catches for 117 yards, operating heavily out of the slot and finding soft spots in Philadelphia’s zone looks. Cooper Kupp caught eight passes for 60 yards and a touchdown, working underneath as Stafford’s safety valve. These Los Angeles Rams vs Philadelphia Eagles match player stats show the Rams’ top two targets combined for 177 yards and 17 receptions, yet Philadelphia’s top wideout averaged over 18 yards per catch and found the end zone. The efficiency gap again appears. Brown generated 3.2 yards per route run, Smith 2.0. Nacua posted 2.8, Kupp 2.1. Tutu Atwell caught one pass for 14 yards. Demarcus Robinson added two catches for 18 yards. The Eagles secondary limited damage after the catch, yielding only 78 total YAC to Rams receivers.
- Brown: 6 rec, 109 yards, 1 TD, 18.2 YPC
- Smith: 4 rec, 50 yards
- Nacua: 9 rec, 117 yards
- Kupp: 8 rec, 60 yards, 1 TD
Tight End Contributions and Red Zone Targets
Dallas Goedert caught four passes for 35 yards, converting two third downs. He ran 24 routes and served as a reliable check-down option. Tyler Higbee recorded three receptions for 24 yards on limited targets, still working back from injury. Neither tight end reached the end zone, but Goedert’s chain-moving catches extended drives that ended in points. Red zone passing targets tilted toward Kupp (two targets, one touchdown) and Brown (one target, one touchdown). The Rams targeted Higbee once inside the 20-yard line without success. Philadelphia did not attempt a red zone throw to Goedert, preferring to lean on Barkley and Hurts near the goal line. This tactical choice shows up clearly in the Los Angeles Rams vs Philadelphia Eagles match player stats, where tight end targets inside the 10 were nonexistent for both teams.
Offensive Line Performance: Sacks Allowed and Pressures
Philadelphia’s defensive front overwhelmed the Rams’ protection. The Eagles sacked Stafford five times, with Josh Sweat and Haason Reddick combining for three. Jalen Carter and Milton Williams each added a sack. Los Angeles managed one sack on Hurts, recorded by Byron Young. Pressure rate told the same story. Philadelphia pressured Stafford on 38 percent of dropbacks, while the Rams pressured Hurts on just 18 percent. Clean-pocket stats favored Philadelphia’s ability to stay on schedule. Hurts posted a 108.3 passer rating from a clean pocket; Stafford posted a 104.7 rating when kept clean but faced far fewer such opportunities. The Rams’ offensive line allowed 12 total pressures. Right tackle Rob Havenstein surrendered two sacks and three pressures. The interior trio gave up eight combined pressures. Those protection breakdowns show up repeatedly in these Los Angeles Rams vs Philadelphia Eagles match player stats, connecting directly to failed third-down conversions and stalled drives.
Defensive Standouts: Sacks, Tackles, and Turnovers
Zack Baun led the Eagles with nine tackles and one tackle for loss. Reed Blankenship added seven stops and broke up a pass. Darius Slay and James Bradberry each defended two passes, limiting the Rams’ perimeter passing game. For Los Angeles, Christian Rozeboom recorded a game-high 10 tackles. Ernest Jones added eight stops. Neither defense forced a turnover. The Los Angeles Rams vs Philadelphia Eagles match player stats on defense highlight a glaring missed opportunity. The Rams failed to take the ball away, while Philadelphia’s pass rush functioned as a turnover-equivalent force, knocking Los Angeles off schedule. Missed tackles also factored. The Rams missed 11 tackles, six of those against Barkley. The Eagles missed five tackles. This tackling discrepancy amplified Philadelphia’s yardage advantage. Ahkello Witherspoon and Cobie Durant each allowed a touchdown pass, matching up against Brown and Smith. Coverage grades from Pro Football Focus rated the Eagles secondary ahead, with an average coverage grade of 72.3 versus the Rams’ 61.4.
Special Teams Impact: Field Goals and Punt Returns
Jake Elliott converted three field goals, with a long of 48 yards, and made all four extra points. Rams kicker Joshua Karty made two field goals from 38 and 42 yards. Britain Covey returned two punts for 18 total yards, giving Philadelphia favorable starting field position. Rams returner Austin Trammell gained 12 yards on two returns. Average starting field position favored the Eagles by 4.3 yards per drive. These hidden yards added to the momentum swing. Punter Braden Mann pinned the Rams inside their own 20 twice. Ethan Evans averaged 46.2 yards per punt with one inside the 20. The Los Angeles Rams vs Philadelphia Eagles match player stats on special teams show a quiet but meaningful edge that helped Philadelphia sustain long scoring drives.
Key Statistical Categories That Decided the Game
A few team-level numbers jump off the page. Philadelphia outgained Los Angeles 481–328 in total yards. The Eagles averaged 7.9 yards per play; the Rams managed 5.3. Time of possession barely favored Philadelphia, 30:14 to 29:46. Third-down efficiency saw the Eagles convert 7-of-12, while Los Angeles went 4-of-11. Red zone efficiency finished at 75 percent for Philadelphia (3-for-4) and 50 percent for the Rams (2-for-4). Rushing success rate—Philadelphia 62 percent, Rams 38 percent—encapsulates the one-sided nature. The Eagles produced nine explosive plays (runs of 10-plus yards, passes of 20-plus yards) compared to four for the Rams. These Los Angeles Rams vs Philadelphia Eagles match player stats paint a clear picture: Philadelphia did not just win; it dominated the hidden yardage and efficiency categories that correlate strongly with victory.
- Total yards: Philadelphia 481, Los Angeles 328
- Yards per play: Philadelphia 7.9, Los Angeles 5.3
- Third downs: Philadelphia 7/12, Los Angeles 4/11
- Red zone: Philadelphia 75%, Los Angeles 50%
- Rushing success rate: Philadelphia 62%, Rams 38%
Complete Los Angeles Rams vs Philadelphia Eagles Match Player Stats Table
Below is a summary of the primary skill-position performers and key defenders, showing passing, rushing, receiving, and defensive metrics side by side.
| Player | Team | Pass Yds | Rush Yds | Rec Yds | Total TDs | Tackles | Sacks |
|---|---|---|---|---|---|---|---|
| Jalen Hurts | PHI | 179 | 39 | – | 2 (1 pass, 1 rush) | – | – |
| Matthew Stafford | LAR | 243 | – | – | 2 | – | – |
| Saquon Barkley | PHI | – | 255 | 47 | 2 | – | – |
| Kyren Williams | LAR | – | 72 | 8 | 2 (1 rush, 1 rec) | – | – |
| A.J. Brown | PHI | – | – | 109 | 1 | – | – |
| DeVonta Smith | PHI | – | – | 50 | 0 | – | – |
| Puka Nacua | LAR | – | – | 117 | 0 | – | – |
| Cooper Kupp | LAR | – | – | 60 | 1 | – | – |
| Dallas Goedert | PHI | – | – | 35 | 0 | – | – |
| Tyler Higbee | LAR | – | – | 24 | 0 | – | – |
| Zack Baun | PHI | – | – | – | – | 9 | 0 |
| Christian Rozeboom | LAR | – | – | – | – | 10 | 0 |
| Josh Sweat | PHI | – | – | – | – | 4 | 2 |
| Haason Reddick | PHI | – | – | – | – | 2 | 1 |
| Jalen Carter | PHI | – | – | – | – | 2 | 1 |
| Milton Williams | PHI | – | – | – | – | 1 | 1 |
This table distills the Los Angeles Rams vs Philadelphia Eagles match player stats into a single reference, letting you compare offensive output and defensive impact at a glance. Philadelphia defenders generated five sacks and held the Rams’ secondary targets in check, while Barkley’s historic line stands out immediately.
Advanced Efficiency Metrics: QBR, Yards Per Attempt, and Success Rates
Hurts posted a 67.8 QBR, reflecting his rushing value and efficient, short-area passing. Stafford recorded a 76.2 QBR. Yards per attempt slightly favored Stafford (6.8 to Hurts’ 6.4). However, the Eagles’ 9.4 yards per play on first down dwarfed the Rams’ 5.1, consistently putting Philadelphia in manageable down-and-distance situations. Success rate on first down for the Eagles sat at 68 percent, for the Rams 42 percent. This early-down dominance allowed Philadelphia to avoid third-and-long repeatedly. Hurts faced only three third-down dropbacks of seven or more yards. Stafford faced eight. These Los Angeles Rams vs Philadelphia Eagles match player stats go deeper than the basic box score, showing how early-down efficiency set the table for the entire game. Philadelphia’s EPA per play was 0.31, more than double the Rams’ 0.12. Barkley’s EPA per rush came in at a monstrous 1.24. No Rams running back exceeded 0.10.
Historical Context: How This Match Compares
Barkley’s 255 rushing yards stand as the second-highest single-game total in Eagles franchise history, trailing only a 1949 performance by Steve Van Buren. It also marks the most rushing yards ever allowed by a Sean McVay-coached Rams defense. The last time a Rams opponent topped 250 yards on the ground was Adrian Peterson in 2012. Meanwhile, Stafford’s 243-yard, two-touchdown, zero-interception day ranks among his cleanest efforts against a top-five defense. Yet his team lost by three scores. This Los Angeles Rams vs Philadelphia Eagles match player stats analysis underscores a rare statistical profile: a quarterback with a 112 passer rating, zero turnovers, and a two-touchdown game suffered a 17-point defeat. Only three times in the previous decade has that happened. The game rewrote a few record-book footnotes and highlighted a modern truth—run game dominance can overwhelm excellent passing efficiency.
Offensive Snap Counts and Personnel Usage
Philadelphia ran 61 offensive snaps. Barkley played 42 snaps (69 percent), touching the ball on 30 of those. Hurts played all 61. Brown logged 52 snaps, Smith 48. Goedert participated in 44 snaps, often as an in-line blocker. The Eagles used 12 personnel (one back, two tight ends) on 22 percent of plays, typically running from that grouping. Los Angeles ran 62 plays. Stafford played all 62. Williams played 44 snaps, rookie Blake Corum saw eight. Nacua and Kupp each played over 55 snaps. Higbee saw 34 snaps in his return. The Rams leaned on 11 personnel (three wide receivers) on 71 percent of snaps, a familiar McVay tendency. These Los Angeles Rams vs Philadelphia Eagles match player stats around snap distribution reveal schematic commitment. Philadelphia’s heavier sets enabled the run game, while the Rams’ spread looks tried to exploit matchups but ultimately faltered against pressure.
Top 5 Player Performances Ranked
Saquon Barkley – 255 rush yards, two long touchdowns, 302 total yards, six missed tackles forced
- Puka Nacua – 9 catches, 117 yards, multiple first-down conversions, 2.8 yards per route run
- A.J. Brown – 6 catches, 109 yards, 1 TD, 18.2 yards per catch, two contested catches
- Matthew Stafford – 243 yards, 2 TDs, 0 INTs, 112.3 passer rating despite relentless pressure
- Josh Sweat – 2 sacks, 4 total pressures, constant disruption off the edge
Honorable mentions go to Zack Baun’s nine tackles and Cooper Kupp’s eight-catch day. The Los Angeles Rams vs Philadelphia Eagles match player stats make it impossible to ignore Barkley’s dominance, but Sweat’s impact set the tone early.
What the Stats Reveal About Both Teams Moving Forward
Philadelphia’s offensive line and run scheme remain a force multiplier. Barkley’s vision and burst turn small creases into explosive gains, and the Eagles defense generates pressure with four rushers at a rate few teams can match. Los Angeles moves the ball efficiently through the air but must generate more on the ground and improve third-down defense. Opposing offenses targeted the middle of the Rams defense for chunk plays all night. The Los Angeles Rams vs Philadelphia Eagles match player stats point to a clear takeaway: defensive line depth and rushing efficiency separate these two NFC contenders. Philadelphia looks built for a deep playoff push. Los Angeles has the passing game to keep pace with anyone, but the lack of a consistent run game and a leaky run defense raises serious questions. Any team studying these numbers will attack the Rams similarly—run early, force third-and-long, and let the pass rush take over.
Frequently Asked Questions
Who had the most passing yards in the Rams vs Eagles game?
Matthew Stafford threw for 243 yards, completing 24 of 36 passes. Jalen Hurts finished with 179 passing yards.
How many rushing yards did Saquon Barkley record against the Rams?
Barkley rushed for 255 yards on 26 carries, scoring two touchdowns. He averaged 9.8 yards per carry and added 47 receiving yards.
Did any receiver top 100 yards in the matchup?
Yes, Puka Nacua led the Rams with 117 receiving yards. A.J. Brown led the Eagles with 109 yards and a touchdown.
How many sacks did the Eagles defense register?
The Eagles sacked Matthew Stafford five times. Josh Sweat, Haason Reddick, Jalen Carter, and Milton Williams all contributed to the sack total.
What was the final score of the Los Angeles Rams vs Philadelphia Eagles game?
The Philadelphia Eagles defeated the Los Angeles Rams 37–20 at SoFi Stadium on November 24, 2024.
Which player scored multiple touchdowns?
Saquon Barkley scored two rushing touchdowns. Kyren Williams scored both a rushing and a receiving touchdown. Jalen Hurts added a passing touchdown and a rushing score.
Game boxes can lie, but player stats tell the truth. Barkley’s historic night, steady quarterback play, and relentless pressure defined this NFC clash. Use this breakdown as your reference. Share it with fellow fans, bookmark it for future debates, and drop a comment with the one stat that surprised you most. Check our next matchup breakdown for another deep dive into the numbers that truly matter.